


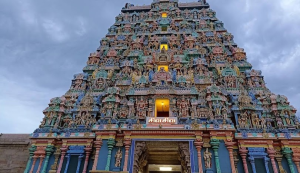


1. Tirupati Pilgrimage | City At a distance of 71 km from Chittoor, 413 km from Vijayawada,...
To promote mutual advantages for its members, a cooperative society implies allocating funds. By the members and/or...
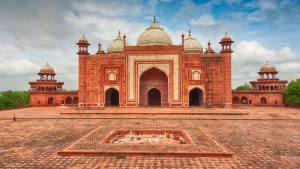
It is often said that historical places have a soul of their own, and we couldn’t agree...
Words like growth, development, world-class infrastructure and multi-nationals have been associated with Bangalore for a long time....
Nestled within easy reach lie enchanting hill stations near Delhi, offering a refreshing escape from the bustling...

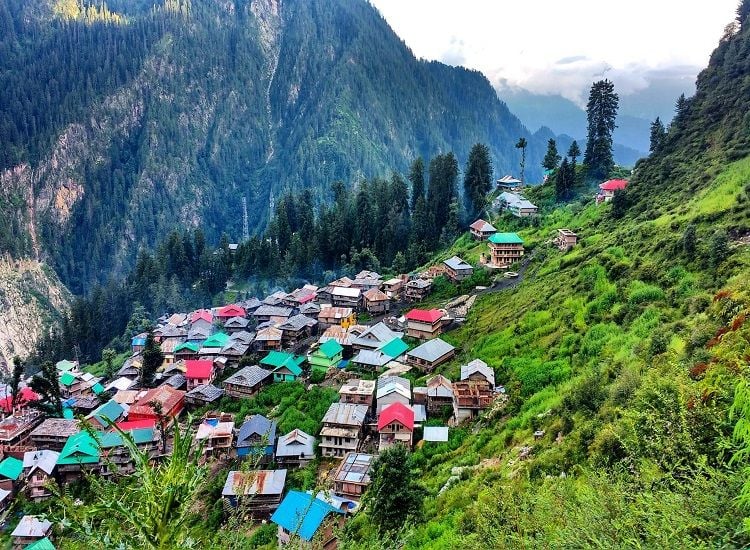
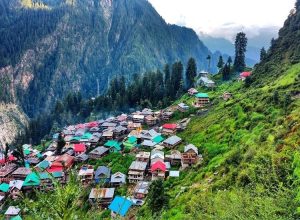
Want to put your feet up for a couple of days, enjoying fresh air and panoramic views...
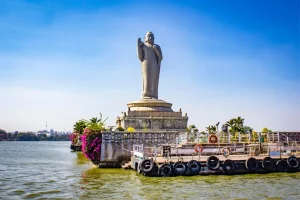
Hyderabad, the capital city of Telangana, is a colourful medley of culture, cuisine, and commerce. Without a...
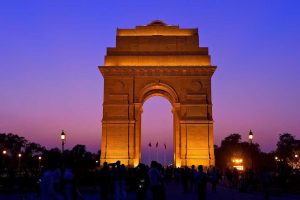
A great city is measured by the character it has and the conversations it starts. And Delhi,...

We spend some of the money we earn on various expenses while earmarking the rest for savings....
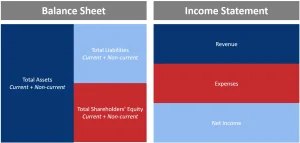
What is a Balance Sheet? A balance sheet is a financial statement that provides a snapshot of...