Operating Ratios also called ‘Activity ratios’ or the ‘Management ratios’ indicate the efficiency of the company’s operational activity. It is another commonly used measurement of liquidity related to turnover, which can be thought of as the speed with which goods and payments flow into and out of the company or a measurement of how quickly noncash assets are converted into cash. These ratios look at how efficiently and effectively a company is using its resources to generate sales and increase shareholder value. In general, the better these ratios are, the better it is for shareholders. Snapshot of current assets and current Liabilities of Exide Industries: –
1. Inventory Turnover Ratio
Inventory turnover measures how many times the inventory is depleted and restocked in the process of producing the goods sold by the firm during the period. It compares the average amount of inventory held to the total amount of raw materials consumed in the course of one period (COGS).
If a company is selling popular products, then the goods in the inventory get cleared rapidly, and the company has to replenish the inventory time and again. This is called the ‘Inventory turnover’. For example – Ribbons & Ballons is known for selling cakes. Since they are popular, they probably know how many cakes he is likely to sell on any given day. For example, he could sell 500 cakes daily across India. This means he has to maintain an inventory of 500 cakes every day. So, in this case, the rate of replenishing the inventory and the inventory turnover is quite high. This may not be true for every business.
For instance, think of a 2-wheeler manufacturer. Selling 2 wheeler is not as easy as selling cakes. If the manufacturer produces 100 2W, he may have to wait for some time before he sells these. Assume, that to sell 100 2W(his inventory capacity) he will need 3 months. This means, that every 3 months he turns over his inventory. Hence in a year, he turns over his inventory 4 times.
The formula for Calculating Inventory Turnover:
Inventory turnover = Cost of goods sold/ Average inventory
Let’s take an example to calculate the inventory ratio for Exide industries:
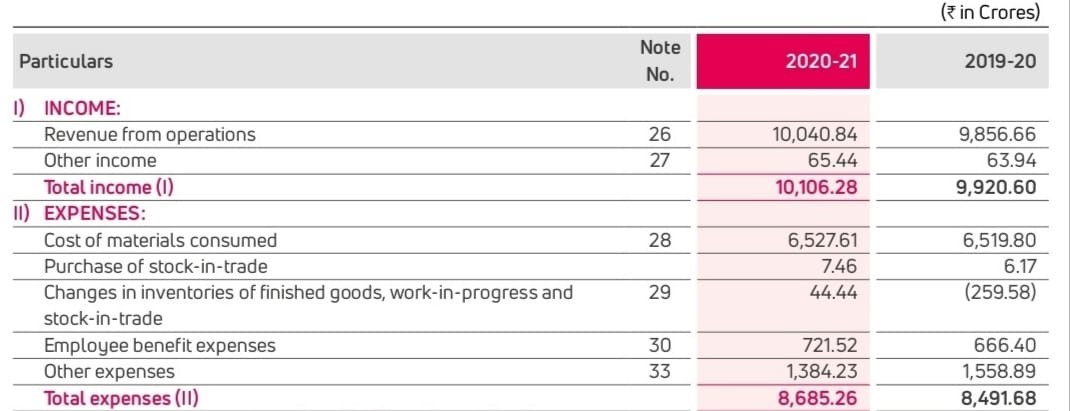
The cost of materials consumed is Rs.6527.61 Crs and purchases of stock-in-trade is Rs.7.46 Crs. These are important components of the Cost of Goods Sold (COGS). Some more expenses are direct and might relate to COGS – to identify these we looked at ‘Other Expenses’.
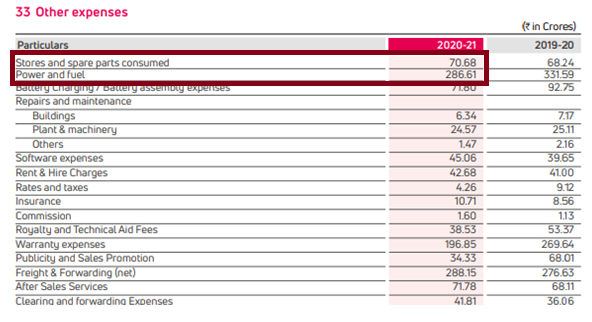
Two expenses are directly related to manufacturing i.e. Stores & spares consumed which is at Rs.70.68 Crs and the Power & Fuel cost which is at Rs.286.6 Crs. Hence the
Cost of Goods Sold (COGS) = Cost of materials consumed + Purchase of stock in trade + Stores & spares consumed + Power & Fuel
COGS = 6527.61+7.46+70.68+286.6 = Rs.6892.35 Crs
The next component we need for calculating the inventory turnover is the inventory for FY21 & FY20.
From the above balance sheet- inventory for FY21 was 2346.19crs & for FY20 was Rs.2192.27crs- avg works to be 2269.23
Inventory Turnover Ratio (COGS/Avg Inventory) = 6829.35/2269.23= 3x
This means that inventory in the case of Exide Industries turns around 3 times a year. To understand how good or bad this number is we should compare this with competitor numbers
Days In Inventory
If we assume the inventory turnover data is calculated as a yearly figure, then by dividing it into 365 days per year we can measure how many days’ worth of production demand are stored as inventory (or equivalently, how long an average item remains in inventory). This is called the days in inventory.
Days in inventory = 365/ Inventory turnover
= 365/3= 121.66 i.e ~122 days
This means Exide Industries roughly takes about 122 days to convert its inventory into cash.
There are two similar ratios dealing with financial turnover.
2. Payables Turnover Ratio
This measures how long the company is taking to pay off the accounts payable (in fractions of a year), with days in accounts payable the corresponding number of days:
Payables turnover = Cost of goods sold/ Average accounts payable
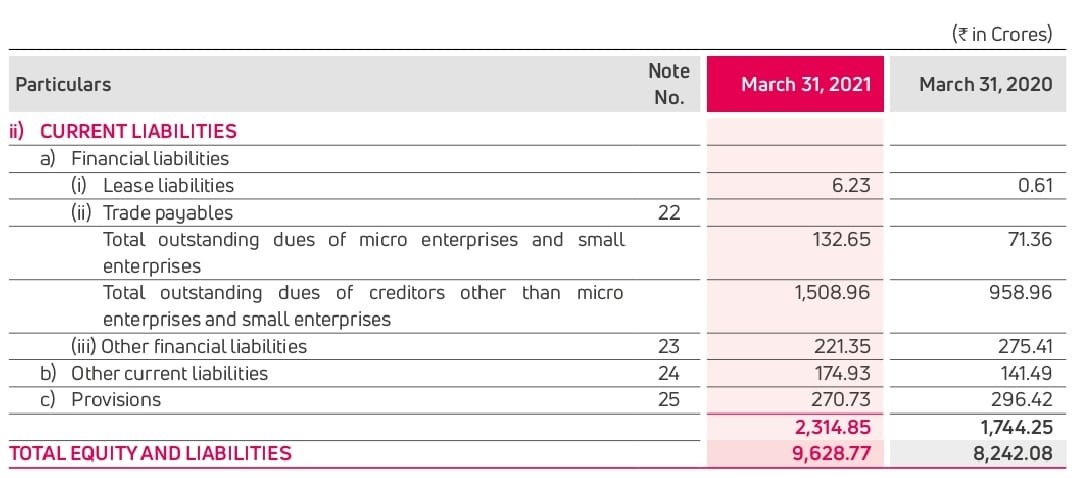
Accounts payable for FY21 is Rs 1641.61crs (132.65+1508.96) & FY20 is Rs. 1030.32 (71.36+958.96) avg of this comes at Rs.1335.96crs
So Payables Turnover is = 6829.35/1335.96= 5.11x
Days in accounts payable = 365/ Payables turnover= 365/5.11= 71.4 days
This means Exide Industries roughly takes about 71 days to pay off its money to its suppliers. This essentially is the credit period that Exide Industries enjoys from its suppliers
3. Receivables Turnover Ratio
Receivables turnover measures how long customers are taking to pay the company in fractional years and days in accounts receivable the corresponding number of days. Naturally, a high number indicates that the company collects cash more frequently
Receivables turnover = Net sales/ Average receivables
From balance sheet-
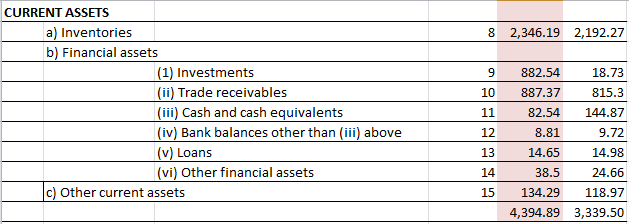
Trade Receivables for FY21 is Rs 887.37crs & FY20 is Rs. 815.30 avg of this comes at Rs.851.35 crs
Net sales for FY21 is 10040.84crs
Receivables Turnover Ratio = 10040.84/851.35=11.8 times
This means Exide Industries receives cash from its customers roughly about 11.8 times a year
Days in accounts receivable = 365/ Receivables turnover
= 365/11.8
= 30.93 days
This means Exide Industry takes about 30 days from the time it sells its products to the time it can collect its money against the sale.
4. Fixed Asset Turnover Ratio
This ratio is a rough measure of the productivity of a company’s fixed assets (property, plant and equipment or PP&E) concerning generating sales. For most companies, their investment in fixed assets represents the single largest component of their total assets. This annual turnover ratio is designed to reflect a company’s efficiency in managing these significant assets. Simply put, the higher the yearly turnover rate, the better it is.
Fixed Assets Turnover = Net Sales / Total Average Asset
For the Exide industry- the total average asset would include fixed assets & the capital work in progress.
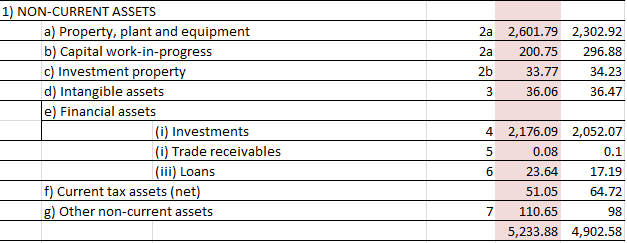
For FY21- total fixed assets= 2601.79+200.75+33.77= Rs.2836.31crs
FY20- total fixed assets= 2302.92+296.88+34.23= Rs.2634crs
Avg total fixed asset = Rs.2735.15crs
Fixed Asset Turnover = 10040.85/2735.15= 3.67x
5. Total Asset Turnover Ratio
The total asset turnover (TAT) ratio measures the degree to which a firm generates sales with its total asset base. Here the assets include both the fixed assets as well as current assets. A higher total asset turnover ratio compared to its historical data and competitor data means the company is using its assets well to generate more sales
Total Asset Turnover = Net Sales / Average Total Assets
For Exide Industries- total assets for FY21 is Rs.9628.77 & FY20 is Rs.8242.08- avg comes to 8935.42
Net Sales is Rs.10040.85crs
Total Asset Turnover = 10040.85/8935.42
= 1.12x
6. Working Capital Turnover Rati
Working capital measures the short-term liquidity of the company and is equal to the difference between the current assets and current liabilities. A company must maintain an adequate buffer of working capital to guarantee that current assets are enough to cover short-term liabilities and avoid an interruption in operations due to an inability to make payments on its obligations. This underscores the significance of “current,” as it applies both to assets (they should be liquid and readily convertible into cash) and liabilities (anything that is coming due in the near term, including the current portion of long-term debt).
Working Capital = Current Assets – Current Liabilities
If the working capital is a positive number, it implies that the company has a working capital surplus and can easily manage its day-to-day operations. However, if the working capital is negative, it means the company has a working capital deficit. Usually, if the company has a working capital deficit, they seek a working capital loan from their bankers.
The working capital turnover ratio is also referred to as Net sales to working capital. The working capital turnover indicates how much revenue the company generates for every unit of working capital. Suppose the ratio is 8, then it indicates that the company generates Rs.8 in revenue for every Rs.1 of working capital. The higher the number, the better it is- as it suggests that the company is generating better sales in comparison with the money it uses to fund the sales.
Working Capital Turnover= Net Sales/ Avg Working Capital
Let’s calculate this for Exide Industries:
Working Capital for FY21= Current Assets- Current Liabilities
= 4394.89crs- 2314.85crs
= Rs.2080.04crs
Working Capital for FY20= Current Assets- Current Liabilities
= 3339.50crs- 1744.25crs
= Rs.1595.25crs
Avg. Working Capital [(2080.04+1595.25)/2] = Rs.1837.62crs
Working Capital Turnover (Net Sales/Avg. Working Capital) = 10040.84/1837.5= 5.46x
The number indicates that for every Rs.1 of working capital, the company is generating Rs.5.46 in terms of revenue.
Financial and Business expert having 30+ Years of vast experience in running successful businesses and managing finance.