This set of ratios explores the impact of leverage (also known as gearing) on the risk of a company. Borrowing funds increases the firm’s potential returns but also increases the riskiness of the enterprise and the potential volatility in earnings from one period to the next.
1. Debt/Equity Ratio
The debt-equity ratio compares a company’s total liabilities to its total shareholder’s equity. This is a measurement of how much suppliers, lenders, creditors and obligors have committed to the company versus what the shareholders have committed.
It measures the amount of the total debt concerning the total equity capital. A value of 1 on this ratio indicates an equal amount of debt and equity capital. Higher debt to equity (more than 1) indicates higher leverage and hence one needs to be careful. A lower than 1 indicates a relatively bigger equity base concerning the debt.
The formula to calculate Debt to Equity ratio is:
Debt Equity Ratio = [Total Debt/Total Equity]
Debt usually includes both long-term & Short term debt.
Since Exide Industries doesn’t have a long-term debt on its books. We won’t be able to calculate these ratios for Exide. Thus to understand this better- let’s take the balance sheet of Britannia Industries:
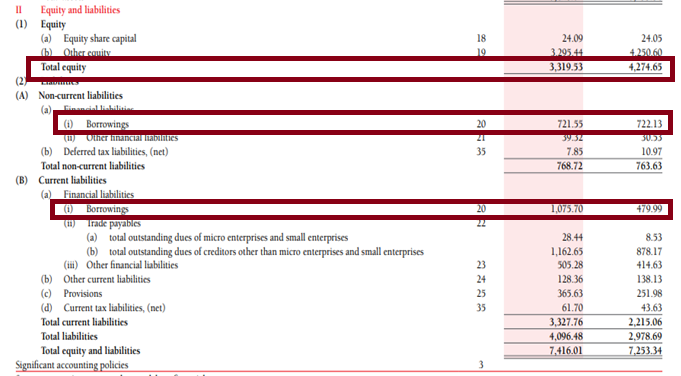
Debt= Long term debt+ short term= 721.55+1075.70= 1797.25 crs
Total Equity= 3319.53 crs
Debt/Equity= 1797.25/3319.53= 0.54
2. Debt Ratio
The debt ratio compares a company’s total debt to its total assets, which is used to gain a general idea as to the amount of leverage being used by a company. A low percentage means that the company is less dependent on leverage, i.e., money borrowed from and/or owed to others. The lower the percentage, the less leverage a company is using and the stronger its equity position. In general, the higher the ratio, the more risk that company is considered to have taken on.
Debt Ratio = Total Debt/Total Assets
The debt ratio gives users a quick measure of the amount of debt that the company has on its balance sheets compared to its assets. The more debt compared to assets a company has, which is signalled by a high debt ratio, the more leveraged it is and the riskier it is considered to be. Generally, large, well-established companies can push the liability component of their balance sheet structure to higher percentages without getting into trouble.
In the case of Britannia- the total debt we know is Rs.3319.53crs
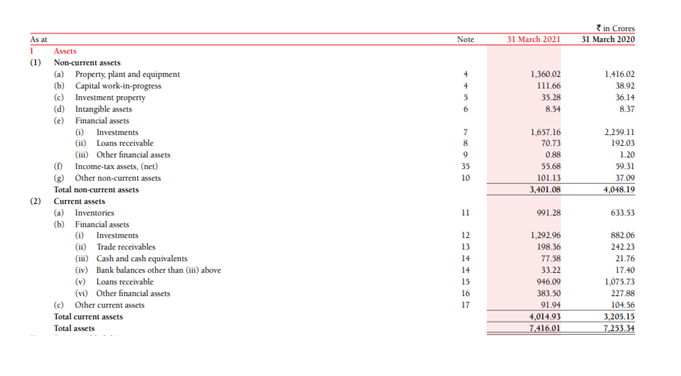
Total Assets is Rs.7416.01crs
Thus Debt/Total Asset= 3319.53/7416.01= 0.44 0r 44%
This means roughly about 44% of the assets held by Britannia are financed through debt capital and therefore 56% is financed by the owners.
3. Financial Leverage Ratio
This ratio of the total assets to total equity. This compares the entire asset base on the left-hand side of the balance sheet with only that portion of shareholders’ equity that belongs to the common shareholders. From the perspective of the common shareholders, the firm’s financial leverage measures how much “stuff” the company owns as compared to how much money they have put in.
Financial Leverage = Total assets/ Total common equity
For Britannia Industries- the total common equity is Rs.3319.5crs
Thus Financial Leverage Ratio= 7416.01/3319.5= 2.23
This means Britannia Industries supports Rs.2.23 units of assets for every unit of equity. Do remember higher the number, the higher the company’s leverage.
4. Interest Coverage Ratio
If the firm has leveraged its shareholder capital by borrowing, it must pay interest on the borrowed funds. The interest coverage ratio (also known as the time’s interest earned ratio) measures the firm’s ability to meet existing debt payments given the current level of earnings. The relevant measure of income for calculating the interest coverage is earnings before interest and taxes (EBIT) since interest payments are themselves tax-deductible expenses.
The lower the ratio, the more the company is burdened by debt expense. When a company’s interest coverage ratio is only 1.5 or lower, its ability to meet interest expenses may be questionable.
Interest Coverage Ratio = EBIT/ Interest expense
In the case of Britannia Industries–
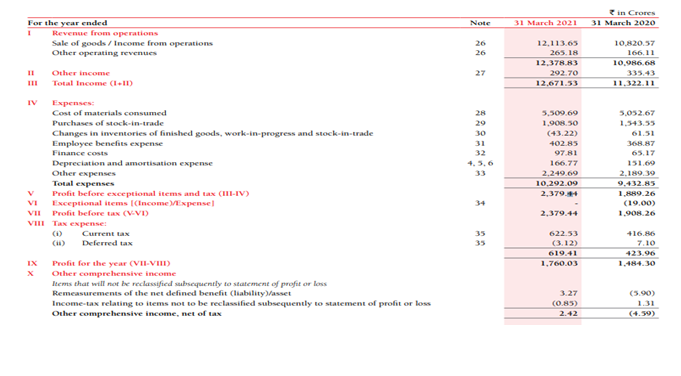
EBIT= Profit before exceptional items & tax+ Finance cost – Other Income
= 2379.44+97.81-292.70
= Rs.2184.55crs
Interest= Rs.97.81
Interest Coverage ratio (2184.55/97.81) = 22.33
An interest coverage ratio of 22.33x suggests that for every Rupee of interest payment due, Britannia Industries is generating an EBIT of 22.33 times.
Financial and Business expert having 30+ Years of vast experience in running successful businesses and managing finance.