Profitability ratios measure one of two characteristics of a company:
- Margins: The difference between what a company spends to manufacture its products and what it makes from selling them.
- Returns: The amount of money a company makes compared to its size.
1. Margins
Based on the various measures of profitability in the income statement profit, operating profit, and net profit we define three progressively more conservative profitability ratios by comparing each of these to net sales:
Gross Profit Margin
It is simply the mark-up on the company’s products, exclusive of any indirect costs of production. A company’s cost of goods sold represents the expense related to labour, raw materials and manufacturing overhead involved in its production process. This expense is deducted from the company’s net sales/revenue, which results in a company’s first level of profit or gross profit.
The gross profit margin is used to analyse how efficiently a company is using its raw materials, labour and manufacturing-related fixed assets to generate profits. A higher margin percentage is a favourable profit indicator. Industry characteristics of raw material costs, particularly as these relate to the stability or lack thereof, have a major effect on a company’s gross margin. Generally, management cannot exercise complete control over such costs. Companies without a production process (ex., retailers and service businesses) don’t have a cost of sales exactly. In these instances, the expense is recorded as a “cost of merchandise” and a “cost of services”, respectively. With this type of company, the gross profit margin does not carry the same weight as a producer-type company.
Gross profit margin = Gross profit/Net sales = (Net sales – Cost of goods sold) / Net sales
In the case of Exide Industries,
Net Sales= 10040.84crs
Cost of Goods Sold= Cost of material consumed+ Purchase of stock in trade+ Changes in inventory of finished goods
= 6527.61+7.46+44.44
= Rs. 6579.51
Gross Profit (10040.84-6579.51) = Rs.3461
Gross profit margin (3461/10040) = 34.47%
Operating Profit Margin/EBITDA Margin
By subtracting selling, general administrative, or operating expenses from a company’s gross profit number, we get operating income. Management has much more control over operating expenses than its cost of sales outlays. Thus, investors need to scrutinize the operating profit margin.
Positive and negative trends in this ratio are, for the most part, directly attributable to management decisions. A company’s operating income figure is often the preferred metric (deemed to be more reliable) of investment analysts, versus its net income figure, for making inter-company comparisons and financial projections.
Operating profit margin = Operating profit/ Net sales
Operating Profit = (Net sales – COGS – SG&A expense – D&A) /Net sales
For Exide industries,
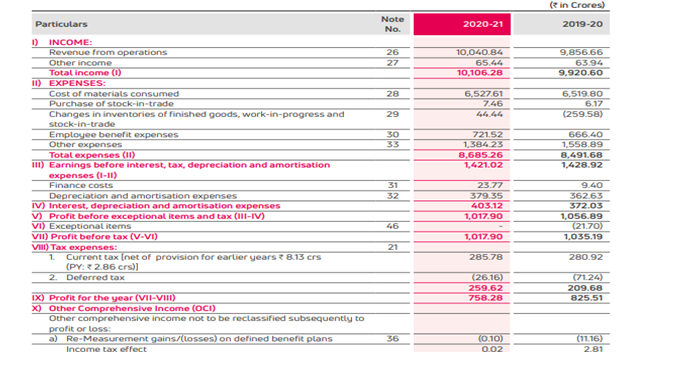
EBIDTA margin= EBIDTA/Net Sales
= 1421.02/10040.84
= 14.15%
This means that the company has retained 14.15% of the revenue at the operating level, for its operations.
Net Profit Margin
This compares the top and bottom lines of the income statement, and is the most conservative measurement of profitability:
Net Profit Margin = Net profit/ Net sales
In the case of Exide Industries-
Net Profit Margin = 758.28/10040.84
= 7.55%
2. Returns
Returns
Most financial considerations boil down, in one way or another, to an assessment of the return on a particular investment, and the risks associated with achieving it. The most general definition of financial return is the return on investment (ROI) which measures the gain from an investment as a percentage of the amount invested:
Return on investment = Gain from investment/ Invested capital
While this calculation is quite straightforward for a simple product (such as a plain-vanilla government bond) the estimation of the return on an equity investment is much more complicated given the idiosyncratic nature of each company and its operations. Due to the vast differences between companies in different industries, there is no single set of metrics that allows for comparison between all companies. Instead, there are many different measurements of return, each of which gives a slightly different view on the company’s performance. Not all metrics are relevant to all companies and within each industry, analysts will focus on those metrics that are most indicative of the actual performance of the companies in that sector. It is only through the analysis of different measures of return and their comparison with industry norms, as well as the specific considerations of the stock in question, that an accurate assessment of profitability can be made.
The other most commonly used measurements of return are as follows:
Return On Equity
This is the most relevant measure of return to the holders of common stock and one of the most important of all financial ratios. ROE measures how much the company is earning relative to the total amount of money left with it by common shareholders (either as paid-in capital from previous share issuances or retained earnings from prior periods).
Return on equity = PAT/Shareholders Fund
If common equity measures all the funds given to the company to work with by its owners, then ROE measures the rate of return the management has been able to produce on those funds in the period after all costs are accounted for. The higher the ratio percentage, the more efficient management is in utilizing its equity base and the better return is to investors.
This ratio is compared with the other companies in the same industry and is also observed over time.
Let’s calculate the same for Exide Industries-
ROE= PAT/ Avg Equity
= 758.28/ 6594.81
= 11.5%
Return On Assets (ROA)
The ROA compares the firm’s net income to its total asset base (the entire left side of the balance sheet). This ratio indicates how profitable a company is relative to its total assets. The return on assets (ROA) ratio illustrates how well management is employing the company’s total assets to make a profit. The higher the return, the more efficient management is in utilizing its asset base.
Return On Assets = Net income/Average total assets
Instead of thinking in terms of assets, one can think in terms of the right-hand side of the balance sheet and view this as the net income generated from all short- and long-term borrowed funds as well as minority interest and preferred and common equity. This measures the firm’s total ability to generate returns with the capital it has been given.
Let’s calculate the ROA of Exide Industries:
ROA= PAT/Avg Total Asset
= 758.28/ Avg Total Assets
Total Asset for FY21 is Rs.7416.01crs and FY20 is Rs. 7253.34crs
Avg Total asset= Rs. 7334.67crs
ROA = 758.28/7334.67
= 10.34%
Du-Point Analysis
The DuPont ratio can be used as a compass in the process of assessing the financial performance of the company by directing the analyst toward significant areas of strength and weakness evident in the financial statements. The DuPont ratio is calculated as follows:
ROE= (Net Income/Sales) * (Sales/Avg Total Asset) * (Avg Asset/Avg Equity)
The ratio provides measures in three of the four key areas of analysis, each representing a compass bearing, pointing the way to the next stage of the investigation.
If you notice the above formula, the denominator and the numerator cancel out with one another eventually leaving us with the original RoE formula which is:
RoE = Net Profit / Shareholder Equity *100
However, in decomposing the RoE formula, we gained insights into three distinct aspects of the business. Let us look into the three components of the DuPont model that make up the RoE formula:
- Net Profit Margin = Net Profits/ Net Sales*100This is the first part of the DuPont Model, and it expresses the company’s ability to generate profits. This is nothing but the PAT margin. A low Net profit margin would indicate higher costs and increased competition.
- Asset Turnover = Net Sales / Average Total Asset asset turnover ratio is an efficiency ratio that indicates how efficiently the company is using its assets to generate revenue.
- Financial Leverage = Average Total Assets / Shareholders EquityThis helps us answer this question – ‘For every unit of shareholders equity, how many units of assets does the company have’.
As you can see, the DuPont model breaks up the RoE formula into three distinct components, with each component giving an insight into the company’s operating and financial capabilities.
Return On Capital Employed (ROCE)
The capital employed by a company is everything on the right side of the balance sheet except for the current liabilities. This includes all long-term financing, minority interest, and shareholders’ equity. The convention is to use the left side of the balance sheet as the reference (since the two sides must be equal) and define capital employed as:
Capital employed = Total assets – Current liabilities
The measurement of profit used in ROCE is the pretax operating profit (the EBIT) which, as observed previously, isolates revenue earned from the mix of debt and equity used to finance it.
ROCE = EBIT/ Capital employed
Financial and Business expert having 30+ Years of vast experience in running successful businesses and managing finance.