1. Time Value Of Money
If we have to evaluate, what would be the value of money that we have today sometime in the future, then we need to move the ‘money today’ through the future. This is called the “Future Value (FV)” of the money. Likewise, if we have to evaluate the value of money that we are expected to receive in the future in today’s terms, then we have to move the future money back to today’s terms. This is called the “Present Value (PV)” of money. In both cases, as there is a passage of time, the money has to be adjusted for the opportunity cost. This adjustment is called “Compounding” when we have to calculate the future value of money. It is called “Discounting” when we have to calculate the present value of money.
The present value of an asset could be shown to be:
PV= FV/(1+r)^t
The Future Value of an asset is calculated as:
FV= PV*(1=r)^t
Where,
PV = Present Value
FV = Future Value
r = Discount Rate
t = Time
Example 1: How much is Rs.10000/- in today’s terms worth five years later assuming an opportunity cost of 10%?
This is a case of Future Value (FV) computation, as we are trying to evaluate the future value of the money that we have today –
Future Value = Present Value * (1+ opportunity cost rate) ^ Number of years.
= 10000 *(1 + 1.10%) ^ 5 = 16105.
This means Rs.10000 today is comparable with Rs.16105 after 5 years, assuming an opportunity cost of 10%
Example 2: How much is Rs.10,000/- receivable after 6 years, worth in today’s terms assuming an opportunity cost of 10%?
This is the case of Present Value (PV) computation as we are trying to evaluate the present value of cash receivable in future in terms of today’s value.
Present Value = Amount / (1+Discount Rate) ^ Number of years
= 10,000 / (1+ 10% ) ^ 6 = 5644
This means Rs.10,000/- receivable after 6 years in future is comparable to Rs.5644 in today’s terms assuming a discount rate of 10%
Thus, the time value of money is like your money getting older. There are things you can do in your 20s that hurt when you are in your 40s. Just try hiking that mountain. Even though the mountain hasn’t changed, it requires a different amount of effort, pain, and dedication to get to the top. The same hundred-rupee note 20 years from now is a lot weaker than that hundred-rupee note in your pocket today – due both to inflation and the interest you could earn on it in the meantime.
2. Net Present Value Of The Asset
Net Present Value (NPV) is the value of all future cash flows (positive and negative) over the entire life of an investment discounted to the present.
It refers to the rupee value derived by deducting the present value of all the cash outflows of the company from the present value of the total cash inflows. It is widely used in finance and to know the profitability of the project.
- If the Net present value is positive, then the project should be accepted. It indicates that earnings from the project are more than the amount invested in the project, so the project should be accepted.
- If the Net present value is negative, then it indicates that the project in which we invested the money does not provide a positive return, so the project should be rejected.
Mathematically, the NPV Formula is represented as,
NPV = Cash Flows /(1- i)t – Initial Investment
Where,
- i stands for the Required Rate of Return or Discount Rate
- t stands for Time or Number of Periods
Example-
Let’s say a friend of yours needs Rs.500 now and will pay you back Rs.570 in a year. Is that a good investment when you can get 10% elsewhere?
Money Out: Rs.500 now
You invested Rs.500 now, so PV = -500.00
Money In: Rs.570 next year
PV = 570 / (1+0.10)1= 570 / 1.10 = Rs.518.18
The Net Amount is:
Net Present Value = 518.18 – 500.00 = 18.18
So, at 10% interest, that investment is worth 18.18
A Net Present Value (NPV) that is positive is good (and negative is bad).
But your choice of interest rate can change things!
Example: Same investment, but try it at 15%
Money Out: 500
You invested 500 now, so PV = -500.00
Money In: 570 next year:
PV = 570 / (1+0.15)1 = 570 / 1.15 = 495.65
Work out the Net Amount:
Net Present Value = 495.65 – 500.00 = -4.35
So, at 15% interest, that investment is worth – Rs.4.35
It is a bad investment. But only because you are demanding it earn 15% (maybe you can get 15% somewhere else at similar risk).
Let us try a bigger example.
Example: Invest Rs.2,000 now, receive 3 yearly payments of Rs.100 each, plus Rs.2,500 in the 3rd year. Use 10% Interest Rate.
Let us work year by year (remembering to subtract what you pay out):
- Now: PV = –2,000
- Year 1: PV = 100 / 1.10 = 90.91
- Year 2: PV = 100 / 1.102= 82.64
- Year 3: PV = 100 / 1.103= 75.13
- Year 3 (final payment): PV = 2,500 / 1.103= 1,878.29
Adding those up gets: NPV = -2,000 + 90.91 + 82.64 + 75.13 + 1,878.29 = 126.97
Looks like a good investment.
Why is the NPV higher when the interest rate is lower?
- Because the interest rate is like the team you are playing against, play an easy team (like a 6% interest rate) and you look good, a tougher team (like a 10% interest) and you don’t look so good!
- You can use the interest rate as a “test” or “hurdle” for your investments: demand that an investment have a positive NPV with, say, 6% interest.
3. Opportunity And Discount Factors
Opportunity Cost
Opportunity cost is the cost of any activity measured in terms of the value of the other alternative that is not chosen (that is foregone). Put another way, it is the benefit you could have received by taking an alternative action; the difference in return between a chosen investment and one that is not taken. Say you invest in a stock and it returns 10% over a year. In placing your money in the stock, you gave up the opportunity of another investment – say, a fixed deposit yielding 8%. In this situation, your opportunity costs are 2% (10% – 8%). But do you expect only fixed deposit returns from stocks? Certainly not. You expect to earn more than the return from a fixed deposit when you invest in stocks. Otherwise, you are better off with fixed deposits. The reason you expect higher returns from stocks is because the stocks are much riskier as compared to fixed deposits. This extra risk that you assume when you invest in stocks calls for additional return that you assume over other risk-free (or near risk-free) returns.
The discount rate of cost of capital to be used in case of discounting future cash flows to come up with their present value is termed as Weighted Average Cost of Capital (WACC).
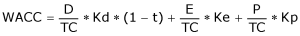
Where
D = Debt portion of the Total Capital Employed by the firm
TC = Total Capital Employed by the firm (D+E+P)
Kd = Cost of Debt of the Company.
t = Effective tax rate of the firm
E = Equity portion of the Total Capital employed by the firm
P = Preferred Equity portion of the Total Capital employed by the firm
Kp = Cost of Preferred Equity of the firm
The Cost of equity of the firm, Ke (or any other risky asset) is given by the Capital Asset
Pricing Model (CAPM)

or,

Where,
Rf = Risk-free rate
β = Beta, the factor signifying risk of the firm
Rm = Implied required rate of return for the market
Risk-Free Rate
- The risk-free interest rate is the theoretical rate of return of an investment with zero risk, including default risk. Default risk is the risk that an individual or company would be unable to pay its debt obligations. The risk-free rate represents the interest an investor would expect from a risk-free investment over a given period.
- Though a truly risk-free asset exists only in theory, in practice most professionals and academics use short-dated government bonds of the currency in question. The risk-free interest rate for the Indian Rupee for Indian investors would be the yield on Indian government bonds denominated in Indian Rupee of appropriate maturity.
- These securities are considered to be risk-free because the likelihood of governments defaulting is extremely low and because the short maturity of the bills protects investors from the interest-rate risk that is present in all fixed-rate bonds.
- Though the Indian government bond is a riskless security per se, a foreign investor may look at India’s sovereign risk which would represent some risk. As India’s sovereign rating is not the highest a foreign investor may consider investing in Indian government bonds as not a risk-free investment.
Equity Risk Premium
- The notion that risk matters and that riskier investments should have higher expected returns than safer investments, to be considered good investments, is central to modern finance.
- Thus, the expected return on any investment can be written as the sum of the risk-free rate and a risk premium to compensate for the risk. The equity risk premium reflects fundamental judgments we make about how much risk we see in an economy/market and what price we attach to that risk.
- In effect, the equity risk premium is the premium that investors demand for the average risk investment and by extension, the discount that they apply to expected cash flows with average risk.
- When equity risk premia rises, investors are charging a higher price for risk and will therefore pay lower prices for the same set of risky expected cash flows. Equity risk premia are a central component of every risk and return model in finance and is a key input into estimating costs of equity and capital in both corporate finance and valuation.
The Beta
The Beta is a measure of the systematic risk of a security that cannot be avoided through diversification. Therefore, Beta measures non-diversifiable risk. It is a relative measure of risk: the risk of an individual stock relative to the market portfolio of all stocks. Beta is a statistical measurement indicating the volatility of a stock’s price relative to the price movement of the overall market. Higher-beta stocks mean greater volatility and are therefore considered to be riskier but are in turn supposed to provide a potential for higher returns; low-beta stocks pose less risk but also lower returns
Thus, it is a measure of the volatility-or systematic risk-of a security or portfolio compared to the market as a whole. Beta data about an individual stock can only provide an investor with an approximation of how much risk the stock will add to a (presumably) diversified portfolio. For beta to be meaningful, the stock should be related to the benchmark that is used in the calculation.
Formula
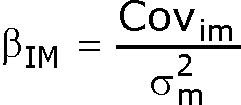
Where,

= Beta of security with market

= Covariance between security and market
![]() = Variance of market returns
= Variance of market returns
OR
Where
![]() = Coefficient of Correlation between security and market returns
= Coefficient of Correlation between security and market returns
How Beta Works?
A beta coefficient can measure the volatility of an individual stock compared to the systematic risk of the entire market. In statistical terms, beta represents the slope of the line through a regression of data points. In finance, each of these data points represents an individual stock’s returns against those of the market as a whole. Beta effectively describes the activity of a security’s returns as it responds to swings in the market. A security’s beta is calculated by dividing the product of the covariance of the security’s returns and the market’s returns by the variance of the market’s returns over a specified period.
Types Of Beta Values
- Beta Value Equal To 1.0
- If a stock has a beta of 1.0, it indicates that its price activity is strongly correlated with the market. A stock with a beta of 1.0 has systematic risk. However, the beta calculation can’t detect any unsystematic risk. Adding a stock to a portfolio with a beta of 1.0 doesn’t add any risk to the portfolio, but it also doesn’t increase the likelihood that the portfolio will provide an excess return.
- Beta Value Less Than One
- A beta value that is less than 1.0 means that the security is theoretically less volatile than the market. Including this stock in a portfolio makes it less risky than the same portfolio without the stock. For example, utility stocks often have low betas because they tend to move more slowly than market averages.
- Beta Value Greater Than One
- A beta that is greater than 1.0 indicates that the security’s price is theoretically more volatile than the market. For example, if a stock’s beta is 1.2, it is assumed to be 20% more volatile than the market. Technology stocks and small-cap stocks tend to have higher betas than the market benchmark. This indicates that adding the stock to a portfolio will increase the portfolio’s risk, but may also increase its expected return.
- Negative Beta Value
- Some stocks have negative betas. A beta of -1.0 means that the stock is inversely correlated to the market benchmark. This stock could be thought of as an opposite, mirror image of the benchmark’s trends. Put options and inverse ETFs are designed to have negative betas. There are also a few industry groups, like gold miners, where a negative beta is also common.
Problems With Beta
- The Beta is just a tool and as is the case with any tool, is not infallible. While it may seem to be a good measure of risk, there are some problems with relying on beta scores alone for determining the risk of an investment. Beta is not a sure thing. For example, the view that a stock with a beta of less than 1 will do better than the market during down periods may not always be true in reality. Beta scores merely suggest how a stock, based on its historical price movements will behave relative to the market.
- Beta looks backward and history is not always an accurate predictor of the future. Beta also doesn’t account for changes that are in the works, such as new lines of business or industry shifts. Indeed, a stock’s beta may change over time though usually, this happens gradually.
Financial and Business expert having 30+ Years of vast experience in running successful businesses and managing finance.