
1. Introduction To Options A derivative is an asset whose value is derived from that of some...
Investment
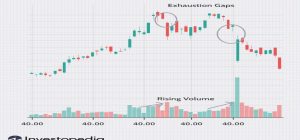
1. What Are Gaps? A gap is an area discontinuity in a security’s chart where its price...
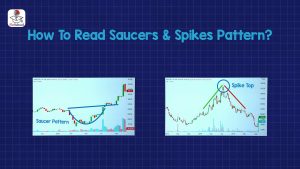
1. The Spike Top The spike top (also called a V-reversal) pictures a sudden change in trend....
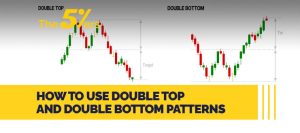
1. Double Top- Meaning A double top is an extremely bearish technical reversal pattern that forms after...
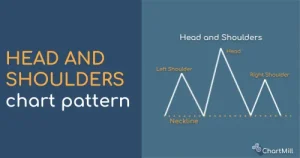
1. Introduction One of the more useful features of chart analysis is the presence of price patterns,...
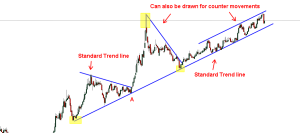
1. Introduction In the following chart, we see a trend line drawn connecting the support levels where...

1. Support & Resistance Support is the level at which demand is strong enough to stop the stock...
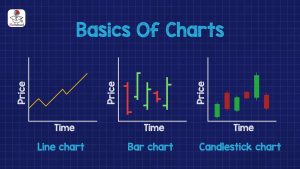
1. Introduction To Line Chart Line charts are the simplest form of charts depicting price changes over an...
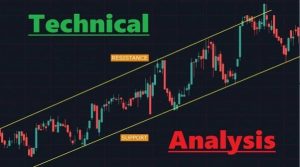
1. What Is Technical Analysis An alternative approach to determining the likely future direction of stock prices...

1. Association For The Mutual Fund Industry? AMFI’s Role in a Mutual Fund 2. What Are The...