The relative strength index (RSI) is a momentum indicator used in technical analysis of the Stock Market. RSI measures the speed and magnitude of a security’s recent price changes to evaluate overvalued or undervalued conditions in the price of that security.
The RSI is displayed as an oscillator (a line graph) on a scale of zero to 100. The indicator was developed by J. Welles Wilder Jr. and introduced in his seminal 1978 book, New Concepts in Technical Trading Systems.
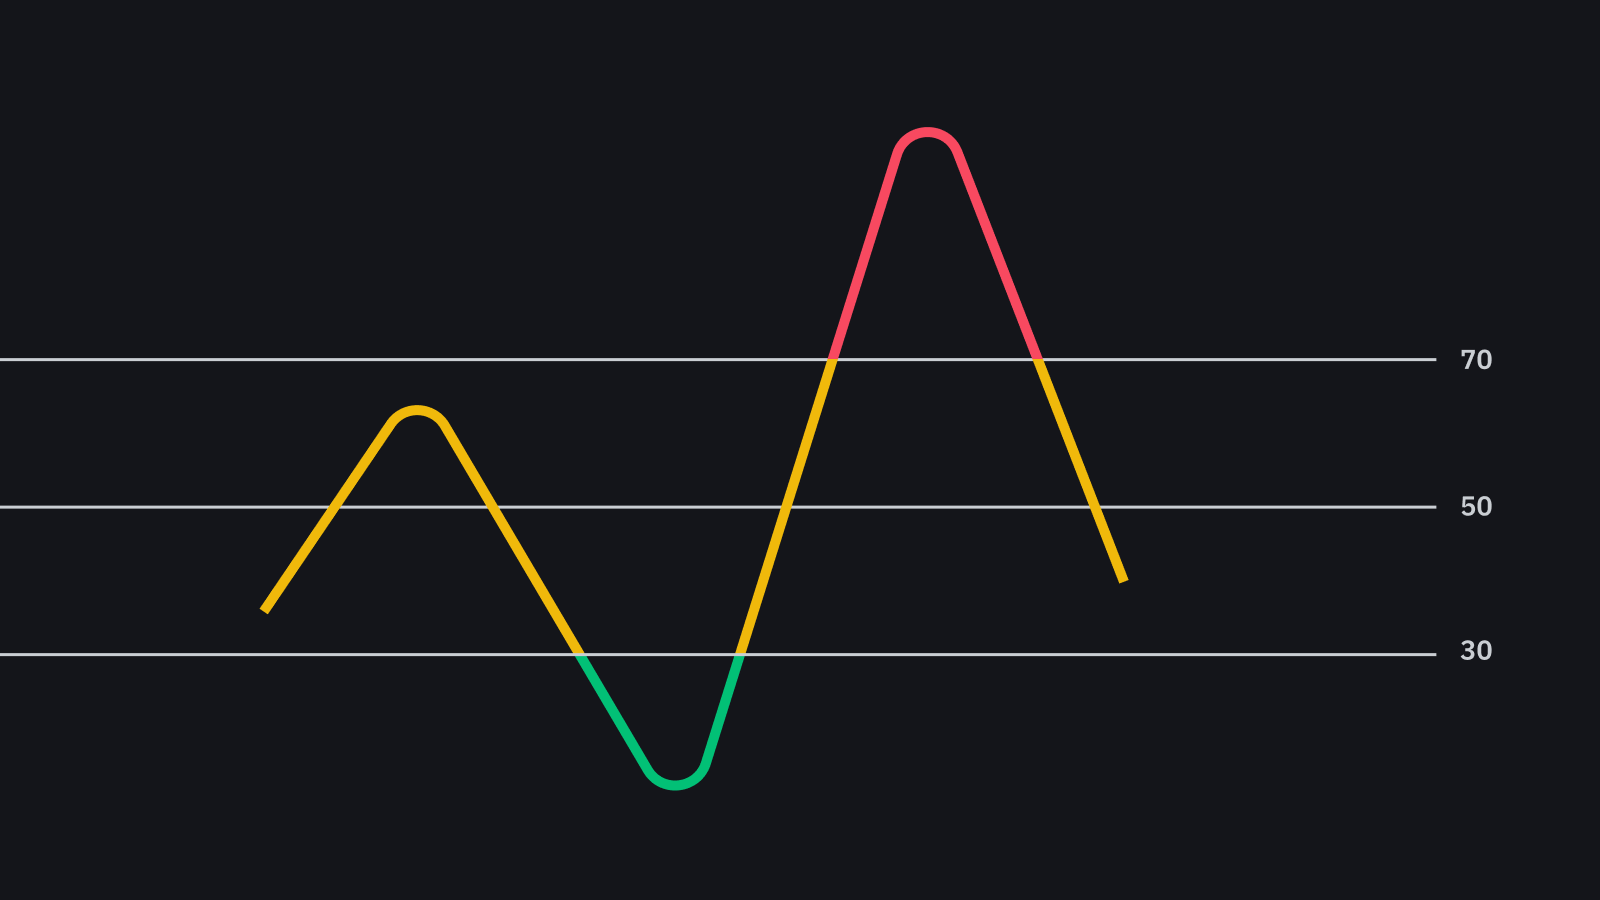
The RSI can do more than point to overbought and oversold securities. It can also indicate securities that may be primed for a trend reversal or corrective pullback in price. It can signal when to buy and sell. Traditionally, an RSI reading of 70 or above indicates an overbought situation. A reading of 30 or below indicates an oversold condition.
RSI Working
As a momentum indicator, the relative strength index compares a security’s strength on days when prices go up to its strength on days when prices go down. Relating the result of this comparison to price action can give traders an idea of how security may perform. The RSI, used in conjunction with other technical indicators, can help traders make better-informed trading decisions.
Calculating RSI
The RSI uses a two-part calculation that starts with the following formula:
RSI_{\text{step one}} = 100- \left[ \frac{100}{ 1 + \frac{\text{Average gain}}{\text{Average loss} }} \right]RSIstep one=100−[1+Average lossAverage gain100]
The average gain or loss used in this calculation is the average percentage gain or loss during a look-back period. The formula uses a positive value for the average loss. Periods with price losses are counted as zero in the calculations of average gain. Periods with price increases are counted as zero in the calculations of average loss.
The standard number of periods used to calculate the initial RSI value is 14. For example, imagine the market closed higher seven out of the past 14 days with an average gain of 1%. The remaining seven days all closed lower with an average loss of −0.8%.
The first calculation for the RSI would look like the following expanded calculation:
55.55 = 100 – \left [ \frac {100 }{ 1 + \frac{ \left ( \frac{ 1\% }{ 14 } \right) }{ \left( \frac{ 0.8\% }{ 14 } \right)} } \right ]55.55=100−⎣⎢⎡1+(140.8%)(141%)100⎦⎥⎤
Once there are 14 periods of data available, the second calculation can be done. Its purpose is to smooth the results so that the RSI only nears 100 or zero in a strongly trending market.
RSI_{\text{step two}} = 100 – \left [ \frac{ 100 }{ 1 + \frac{ \left ( \text{Previous Average Gain} \times 13 \right ) \ + \ \text{Current Gain} }{ \left ( \left ( \text{Previous Average Loss} \times 13 \right ) \ + \ \text{Current Loss} \right ) } } \right ]RSIstep two=100−[1+((Previous Average Loss×13) + Current Loss)(Previous Average Gain×13) + Current Gain100]
Plotting RSI
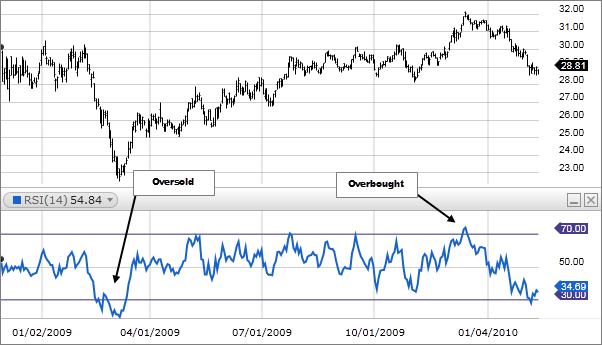
After the RSI is calculated, the RSI indicator can be plotted beneath an asset’s price chart, as shown below. The RSI will rise as the number and size of up days increase. It will fall as the number and size of down days increase. As you can see in the above chart, the RSI indicator can stay in the overbought region for extended periods while the stock is in an uptrend. The indicator may also remain in oversold territory for a long time when the stock is in a downtrend. This can be confusing for new analysts, but learning to use the indicator within the context of the prevailing trend will clarify these issues.
RSI is Important
- Traders can use RSI to predict the price behaviour of security.
- It can help traders validate trends and trend reversals.
- It can point to overbought and oversold securities.
- It can provide short-term traders with buy and sell signals.
- It’s a technical indicator that can be used with others to support trading strategies.
Modify RSI Levels to Fit Trends
The primary trend of security is important to know to properly understand RSI readings. For example, well-known market technician Constance Brown, CMT, proposed that an oversold reading by the RSI in an uptrend is probably much higher. Likewise, an overbought reading during a downtrend is much lower.
On the other hand, modifying overbought or oversold RSI levels when the price of a stock or asset is in a long-term horizontal channel or trading range (rather than a strong upward or downward trend) is usually unnecessary.
The relative strength indicator is not as reliable in trending markets as it is in trading ranges. In fact, most traders understand that the signals given by the RSI in strong upward or downward trends often can be false.
Use Buy and Sell Signals That Fit Trends
A related concept focuses on trade signals and techniques that conform to the trend. In other words, using bullish signals primarily when the price is in a bullish trend and bearish signals primarily when a stock is in a bearish trend may help traders avoid the false alarms that the RSI can generate in trending markets.
Overbought or Oversold
Generally, when the RSI indicator crosses 30 on the RSI chart, it is a bullish sign and when it crosses 70, it is a bearish sign. Put another way, one can interpret that RSI values of 70 or above indicate that a security is becoming overbought or overvalued. It may be primed for a trend reversal or corrective price pullback. An RSI reading of 30 or below indicates an oversold or undervalued condition.
Overbought refers to a security that trades at a price level above its true (or intrinsic) value. That means that it’s priced above where it should be, according to practitioners of either technical analysis or fundamental analysis. Traders who see indications that a security is overbought may expect a price correction or trend reversal. Therefore, they may sell the security.
The same idea applies to security that technical indicators such as the relative strength index highlight as oversold. It can be seen as trading at a lower price than it should. Traders watching for just such an indication might expect a price correction or trend reversal and buy the security.
Interpretation of RSI and RSI Ranges
During trends, the RSI readings may fall into a band or range. During an uptrend, the RSI tends to stay above 30 and should frequently hit 70. During a downtrend, it is rare to see the RSI exceed 70. In fact, the indicator frequently hits 30 or below.
These guidelines can help traders determine trend strength and spot potential reversals. For example, if the RSI can’t reach 70 on a number of consecutive price swings during an uptrend, but then drops below 30, the trend has weakened and could be reversing lower.
The opposite is true for a downtrend. If the downtrend is unable to reach 30 or below and then rallies above 70, that downtrend has weakened and could be reversing to the upside. Trend lines and moving averages are helpful technical tools to include when using the RSI in this way.
Be sure not to confuse RSI and relative strength. The first refers to changes in the price momentum of one security. The second compares the price performance of two or more securities.
Example of RSI Divergences
An RSI divergence occurs when the price moves in the opposite direction of the RSI. In other words, a chart might display a change in momentum before a corresponding change in price.
A bullish divergence occurs when the RSI displays an oversold reading followed by a higher low that appears with lower lows in the price. This may indicate rising bullish momentum, and a break above oversold territory could be used to trigger a new long position.
A bearish divergence occurs when the RSI creates an overbought reading followed by a lower high that appears with higher highs on the price.
As you can see in the following chart, a bullish divergence was identified when the RSI formed higher lows as the price formed lower lows. This was a valid signal, but divergences can be rare when a stock is in a stable long-term trend. Using flexibly oversold or overbought readings will help identify more potential signals. Example of Positive-Negative RSI Reversals
An additional price-RSI relationship that traders look for is positive and negative RSI reversals. A positive RSI reversal may take place once the RSI reaches a low that is lower than its previous low at the same time that a security’s price reaches a low that is higher than its previous low price. Traders would consider this formation a bullish sign and a buy signal.
Conversely, a negative RSI reversal may take place once the RSI reaches a high that is higher than its previous high at the same time that a security’s price reaches a lower high. This formation would be a bearish sign and a sell signal.
Example of RSI Swing Rejections
Another trading technique examines RSI behaviour when it is reemerging from overbought or oversold territory. This signal is called a bullish swing rejection and has four parts:
- The RSI falls into oversold territory.
- The RSI crosses back above 30.
- The RSI forms another dip without crossing back into oversold territory.
- The RSI then breaks its most recent high.
There is a bearish version of the swing rejection signal that is a mirror image of the bullish version. A bearish swing rejection also has four parts:
- The RSI rises into overbought territory.
- The RSI crosses back below 70.
- The RSI forms another high without crossing back into overbought territory.
- The RSI then breaks its most recent low.
The Difference Between RSI and MACD
The moving average convergence divergence (MACD) is another trend-following momentum indicator that shows the relationship between two moving averages of a security’s price. The MACD is calculated by subtracting the 26-period exponential moving average (EMA) from the 12-period EMA. The result of that calculation is the MACD line.
A nine-day EMA of the MACD, called the signal line, is then plotted on top of the MACD line. It can function as a trigger for buy and sell signals. Traders may buy the security when the MACD crosses above its signal line and sell, or short, the security when the MACD crosses below the signal line.
The RSI was designed to indicate whether a security is overbought or oversold in relation to recent price levels. It’s calculated using average price gains and losses over a given period of time. The default time period is 14 periods, with values bounded from 0 to 100.
The MACD measures the relationship between two EMAs, while the RSI measures price change momentum in relation to recent price highs and lows. These two indicators are often used together to provide analysts with a more complete technical picture of a market.
These indicators both measure the momentum of an asset. However, they measure different factors, so they sometimes give contradictory indications. For example, the RSI may show a reading above 70 for a sustained period of time, indicating security is overextended on the buy side.
At the same time, the MACD could indicate that buying momentum is still increasing for security. Either indicator may signal an upcoming trend change by showing divergence from price (the price continues higher while the indicator turns lower, or vice versa).
Limitations of the RSI
The RSI compares bullish and bearish price momentum and displays the results in an oscillator placed beneath a price chart. Like most technical indicators, its signals are most reliable when they conform to the long-term trend.
True reversal signals are rare and can be difficult to separate from false alarms. A false positive, for example, would be a bullish crossover followed by a sudden decline in a stock. A false negative would be a situation where there is a bearish crossover, yet the stock suddenly accelerated upward.
Since the indicator displays momentum, it can stay overbought or oversold for a long time when an asset has significant momentum in either direction. Therefore, the RSI is most useful in an oscillating market (a trading range) where the asset price is alternating between bullish and bearish movements.
What Does RSI Mean?
The relative strength index (RSI) measures the price momentum of a stock or other security. The basic idea behind the RSI is to measure how quickly traders are bidding the price of the security up or down. The RSI plots this result on a scale of 0 to 100.
Readings below 30 generally indicate that the stock is oversold, while readings above 70 indicate that it is overbought. Traders will often place this RSI chart below the price chart for the security, so they can compare its recent momentum against its market price.
Should I Buy When RSI Is Low?
Some traders consider it a buy signal if a security’s RSI reading moves below 30. This is based on the idea that the security has been oversold and is therefore poised for a rebound. However, the reliability of this signal will depend in part on the overall context. If the security is caught in a significant downtrend, then it might continue trading at an oversold level for quite some time. Traders in that situation might delay buying until they see other technical indicators confirm their buy signal.
What Happens When RSI Is High?
As the relative strength index is mainly used to determine whether a security is overbought or oversold, a high RSI reading can mean that a security is overbought and the price may drop. Therefore, it can be a signal to sell the security.
Difference Between RSI and (MACD)
RSI and moving average convergence divergence (MACD) are both momentum measurements that can help traders understand a security’s recent trading activity. However, they accomplish this goal in different ways.
In essence, the MACD works by smoothing out the security’s recent price movements and comparing that medium-term trend line to a short-term trend line showing its more recent price changes. Traders can then base their buy and sell decisions on whether the short-term trend line rises above or below the medium-term trend line.
Financial and Business expert having 30+ Years of vast experience in running successful businesses and managing finance.