
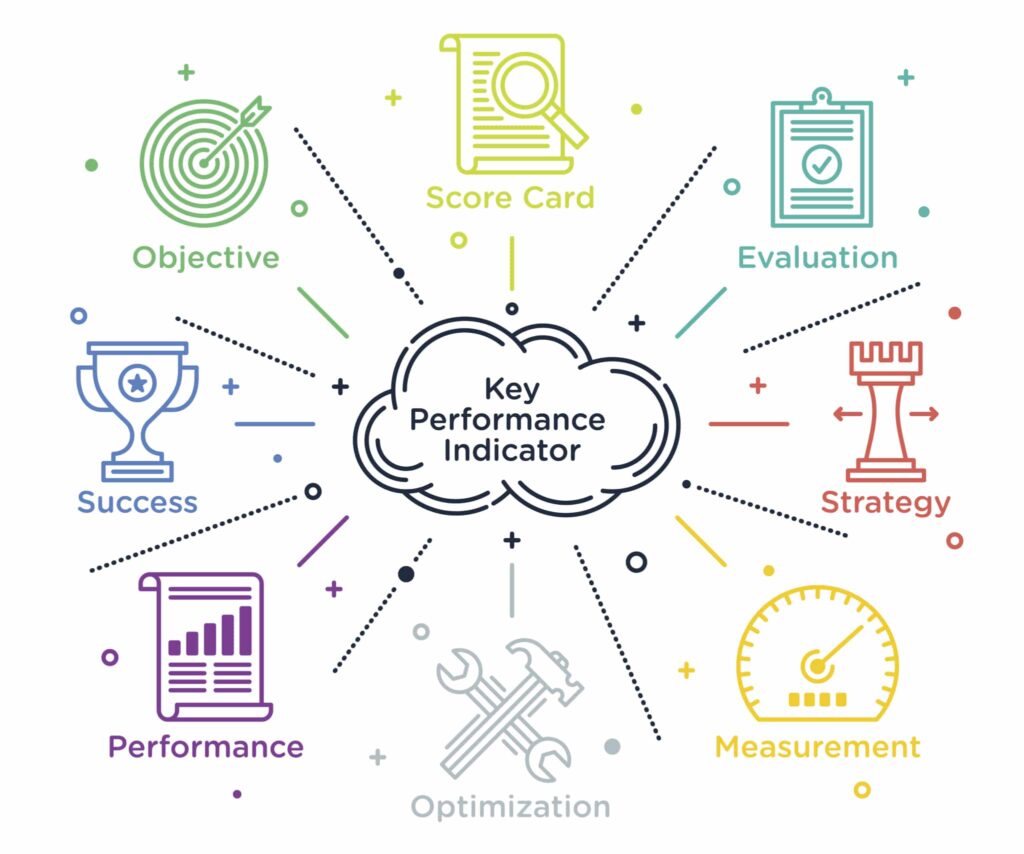
KPI is a performance indicator or key performance indicator is a type of performance measurement which evaluate the success of an organisation or of a particular activity in which it engages.
Key Performance Indicators are one of the most important tools a business has at its disposal. While the premise has existed for a long time, it is only with the advent of the Internet that its full potential has been realised. This is particularly the case in measuring online engagements, such as sales or customer acquisition. From free tools, such as Google Analytics, to highly complex software, there are many different types of KPIs measuring immensely diverse metrics.
Define a KPI
So what makes a KPI effective? How do you define a KPI and cultivate metrics that provide insightful and easily acted upon information? While it is true that KPIs differ from sector to sector, in fact, competitors with many of the same needs might differ wildly in their use of KPIs depending on philosophy and strategy, a good place to start would be common use within a specific industry.
From here it is essential to define your goals, where you might need to increase efficiency for example, before delving into the specifics of a KPI. This may take some time, but the better the research, the more likely the KPI will harvest insightful results.
It is also very important to set goals that are achievable. KPIs are about focused data, not setting ambitious targets that can skew performance away from cohesive strategies.
One of the most effective ways of evaluating the effectiveness and appropriateness of a KPI is the SMART criteria.
SMART stands for Specific, Measurable, Attainable, Relevant, Time-Bound:
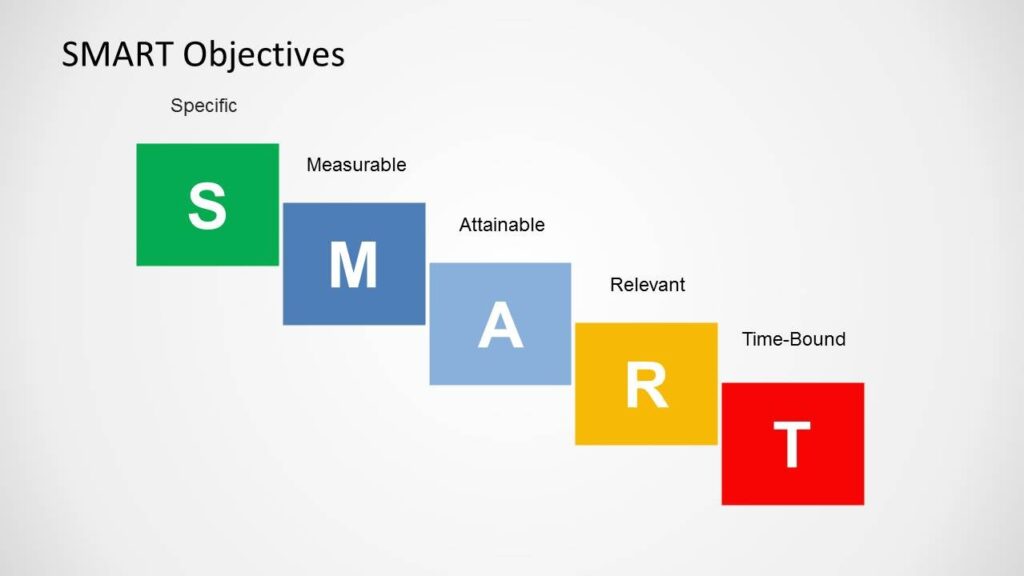
- How SPECIFIC is the goal?
- Is it clearly MEASURABLE?
- How ATTAINABLE is it?
- Is it RELEVANT to the business?
- What Is the TIME Frame to achieve the objective?
Once all these criteria have been met, a KPI can be properly designed and implemented with confidence. However, it will need monitoring and some tinkering may be necessary once the KPI has been fully integrated.
Key Performance Indicators (KPI)
KPI, or Key Performance Indicators, are performance metrics that measure specific goals for businesses across all sectors. Sometimes referred to as KSI (Key Success Indicators), when designed and implemented properly they can define the direction of a business, provide essential feedback and help organise individuals, teams, projects or entire businesses to optimize performance.
A common theme throughout this article will be pointing out how KPIs differ vastly in how they are designed and what they measure. This is crucial to understand their effectiveness and how they should be implemented and read. For example, high indicators might measure the overall performance of an E-commerce business (profits), while low indicators might measure sales of a specific product or output of a specific department.
In other words, KPIs can be helpful for departments, employees, managers, processes and even customer support teams.
Common things Key Performance Indicators might track are:
- Revenue (including average profits, total revenue, and new customers)
- Employment statistics (Including employee turnover, employee performance, and vacancies)
- Customer service (Including average call time, efficiency and customer satisfaction)
- Marketing (Including sales generation and overall effectiveness)
- Efficiency (Including overall efficiency, departmental processes and individual efficiency)
Calculation of KPI

Knowing how to measure a KPI is a matter of defining specific goals from the outset. A startup is likely to be more interested in tracking how many new customers are being brought to the business than an established public company, who might be more focused on tracking share price and profit.
The most common tool for tracking KPIs is web analytics. Google Analytics is able to track a myriad of data, from website performance to new subscribers, to sales. The issue with such hard data, however, is that sometimes the metric that requires tracking is often somewhat intangible, or at least a lot more open to individual interpretation. This may also become harder to measure when dealing with aspects of customer satisfaction. Typically, these types of metrics will require more than one Key Performance Indicator, but it is important not to get carried away, as too much data can confuse things. As ever, focusing on the right KPI is vital, typically designing them with a narrower scope.
One of the most important ways of tracking metrics through KPIs is related to presentation. Google Analytics is a perfect example of how to present, what can be quite complex data, in a clear way. Visualisations that can provide deep insights, for example, are a far better way of getting across the important data than dense presentations that provides no interactivity. This becomes particularly important when dealing with multiple KPIs.
It should be noted that KPIs require constant evaluation to ensure they remain relevant and focused on the important parts of the business that need tracking.
Types of KPI
As KPIs can be employed to measure deeply diverse metrics across a myriad of sectors and processes, types of KPI differ wildly in how they are designed and implemented. The core purpose might remain the same, to provide concise data on various aspects of a business, but the similarities often end there.
Three of the most common types of KPIs are for:
- Companies
- Teams
- Projects
Companies
Although company KPIs might sound rather broad in its ambitions, they can be, and in fact typically should be, focused on specific areas of company performance. For customer metrics, these can be as diverse as acquisition, lifetime value of customers, retention and customer loyalty.
On the employee side, KPIs are often used to measure certain business goals, performance (including measuring the strengths of specific employees). Well-being is increasingly an important issue and is related employee retention rates, both of which can also be perfectly gauged with the right tools.
Teams
KPIs for marketing requires vastly different insights than KPIs for sales, as is the case for human resources, or any other department you can think. For this reason, Key Performance Indicators for teams are one of the most varied of all its types.
A financial team will likely be tracking revenue, expenses, profit, and cash flows. A sales team customer capture, average deal size or revenue targets. These two departments, of course, have some degree of crossover, but a customer support team, with its customer satisfaction focus, might want to measure the results of surveys or caller wait times, a very different set of metrics.
Marketing groups often require some of the most complex KPIs, with generated sales and brand awareness at the heart of their focus. This might include Google Analytic KPIs with its in-depth conversion rate data (the percentage of visitors who have taken the desired action, such as sales or subscriptions).
Human Resources teams again have a less easily defined set of metrics to measure, such as the previously mentioned employee happiness and turnover. They may also measure how long it takes to fill a position and the number of responses to a given vacancy.
Projects
Measuring the value of a project is key to understand how successful it is in a broad sense, which aspects are working well, which aspects are underperforming and how to cultivate fruitful and realistic goals. The first thing that needs to be defined for a project is its goals, and this will define the KPI from the outset.
It should be noted that employing too many KPIs for any aspect of a business can dilute its focus and confuse matters greatly. This is where careful preplanning and clearly defined goals can help.
KPIs vs OKRs
A new variant on KPIs is OKRs (Objectives and Key Results). In recent years these have become increasingly popular, partly due to Google apparently using them to great effect. There is much overlap between the two, but the main difference is in their ambition. OKRs are not defined as obtainable goals based on previous data, rather they are ambitious goals with clearly defined steps outlined to achieve that goal. They should not be seen as unreachable targets, but motivational ones.
It would be wrong to compare the usefulness of KPIs and OKRs as they are designed with different outlooks on goals, but a good rule of thumb would be KPIs assess clear goals based on previous data. OKRs, on the other hand, are better implemented for entirely new goals that require a broader vision.
KPI Templates
KPIs are only as successful as the template and interface they present. As previously mentioned, these are typically unique to the types of data they are measuring.
Website KPI examples tend to be well encapsulated by Google Analytics, with its drill-down data on broad, but related, topics such as conversion rates and returning visitors. One of the traps that businesses often fall into is what is often referred to as vanity metrics. This is where a superficial reading of positive data, such as a growing number of visitors, is seen as success alone. As ever with Google KPI examples, it is essential to drill down further to fully ascertain what these numbers mean. For example, are these visitors the right type of visitor the business is looking for?
Social media KPI examples are also well designed and defined by in-depth on-site analytics. Twitter, for example, has a very effective template that offers the type of drill-down data that Google provides. Combined with other software, these can offer great insights regarding customer reach, acquisition and brand awareness.
Financial and Business expert having 30+ Years of vast experience in running successful businesses and managing finance.